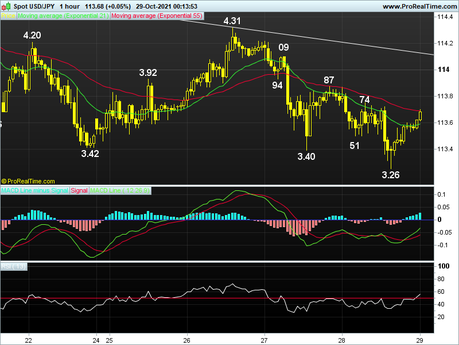
USD / JPY Daily Technical Outlook
Last updated at October 29, 2021 00: 24GMT.
Daily trend chart
Next to
Daily indicators
Facilitate fm o / bot
21 RH EMA
113.59
55 RH EMA
113.69
Hourly trend chart
Next to
Hourly indicators
Bullish convergences.
13 RH RSI
55
14 RH DMI
+ ve
Daily Analysis
Consolidation with a neutral bias.
Resistance
114.31 - Mar is high.
114.09 - Wednesday's European high.
113.87 - New York's tallest from Mer.
Support
113.26 - The game's 2 week low.
113.01 - October 12 low.
112.76 - 50% r of 110.83-114.69.
USD / JPY - 113.69 .. The Dlr was sold again to 113.86 on Thursday shortly after the Asian open n fell to 113.51, despite a near term rebound. At 113.74 in the European morning, the USD sell-off in NY brought the price down to 113.26.
Overall, dlr's drop from 118.66 (December 2016) to 2019 low to 104.46 (September) confirms that the early 2016 uptrend to 99.00 has peaked. Although it hit a 3.5-year low at 101.19 in March 2020 on risky trades due to the COVID-19 pandemic, the dlr rally to 111.71 in the same month signals the end of the correction. Despite the erratic drop in dlr to 102.60 (Jan 2021), the subsequent rise to 116.65 in early July signals that the pullback is complete. The 2020 3.5-year low at 101.19 is on its way to 115.51, overbought readings on the daily indicators would cap the price below 118.66. Only risks less than 113.01 risk 112.07.


