EUR / USD Weekly Technical Outlook
Last updated at 25 October 2021 00:05 GMT.
Daily trend chart
Down
Daily indicators
Turn
21 RH EMA
1.1638
55 RH EMA
1.1637
Hourly trend chart
Next to
Hourly indicators
Neutral
13 RH RSI
53
14 RH DMI
-ve
Daily Analysis
Consolidation b4 still rising.
Resistance
1.1703 - September 28 maximum.
1.1669 - High of last week (Tue).
1.1655 - Last Friday high.
Support
1.1617 - Last Wednesday low.
1.1609 - Last Tuesday low (AUS).
1.1572 - Last week low (Monday).
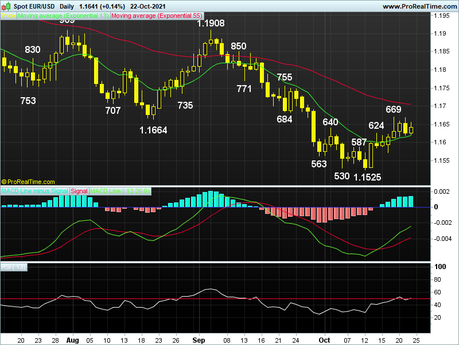
EUR / USD - 1.1640 .. Although the euro has extended its initial rise after the new 14 month October low of 1.1525 initially last week to a nearly 3 week high of 1.1669 on Tuesday , the price fell back to 1.1617 (Wednesday) and flipped sideways for the remainder of the week.
Overall, despite the 2017 euro fm LT rising near the 14-year low of 1.0341 to a new 3-year high of 1.2555 in mid-February 2018, the decline in the euro to an almost 3-year low of 1.0637 in March 2020 signals the correction has ended. Despite setting up an impressive advance to an almost 33-month high at 1.2349 in early January 2021, the subsequent sell at 1.1705 (March) signals the high. Although the euro climbed to 1.2266 in May, the subsequent breakout of 1.1705 to a 9-1 / 2 month low of 1.1664 in mid-August signals a major high is achieved. The euro's weakness to a new 14-month low of 1.1525 in October would prolong the MT fm's fall from 1.2349 to 1.1473 but believes that 1.1422 could hold the first test. Tuesday's breakout of 1.1664 could head towards 1.1745 / 55b4 lower.
Today, the daily jerky swings of the euro after the pullback from 1.1669 to 1.1617 would give rise to further consolidation, as long as said reaction holds, the rise of fm 1.1525 could head towards 1, 1703, however, "bearish divergences" on hourly indicators should cap the price below 1.1755. A daily close below 1.1617 would return 1.1572.


